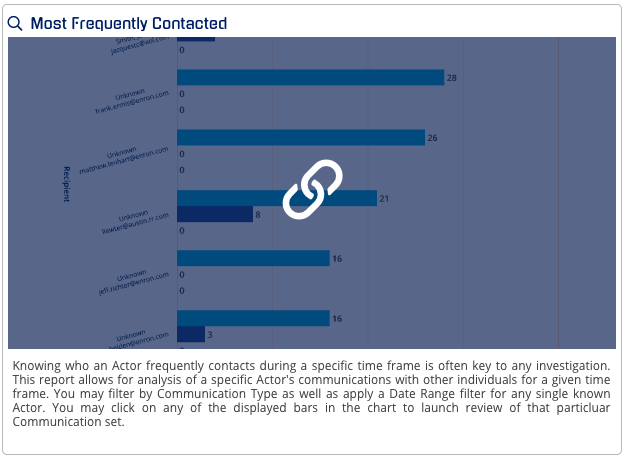
Knowing who an Actor frequently contacts during a specific time frame is often key to any investigation. This analysis tool allows for the visualization of a specific Actor's communications with other individuals across all communication points or there are filters to hone in on specific types and dates.
Navigating to The Most Frequently Contacted Analysis Tool
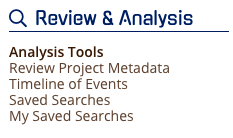
To get to the Most Frequently Contacted Analysis Tool, you can click Analysis Tools on the right pop-out bar under Review and Analysis.
As a shortcut, you can click on "Communication" at the top of the tools to show just the Communication Tools

You will want to select Most Frequently Contact anywhere in the graphic.
Using the Conditions for Analysis
Enter in the range for which you wish to examine frequency using the filters to the left below and then click "Apply". The chart will then be rendered. You may only select one Actor.
NOTE: Given search parameters, when passing filter values to Review by clicking on the chart or the table links provided, the number of values returned in Review may be slightly different, as the filter uses a "contains" parameter. This may result in over-inclusive results in the Review interface being displayed as Actors being searched may include others on the communications (multiple recipients / group communications).
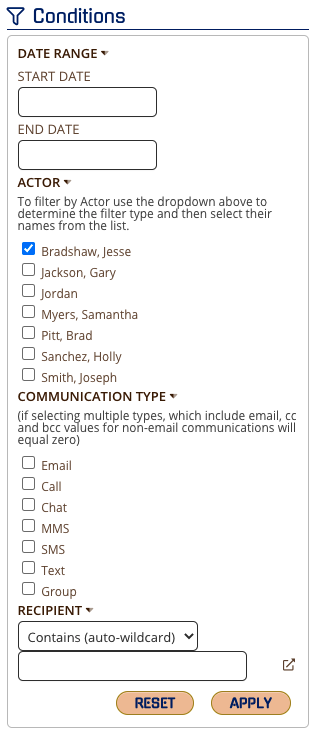
To hone in on a specific time or type, you can filter by Date Range, single known Actor, or Communication Type.
Note: You MUST have at least one actor profile created for this Analysis Tool to work.
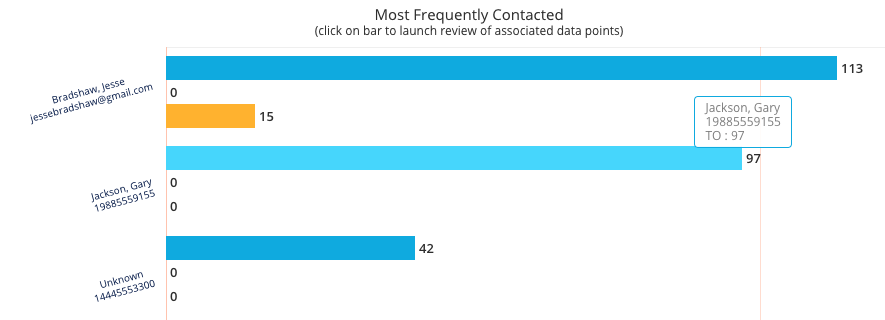
Once you select your criteria and one actor and click APPLY, you may click on any of the displayed bars in the chart to launch review of that particular Communication set. Any bar is interactive and will take you to the review page where you can see those communications.
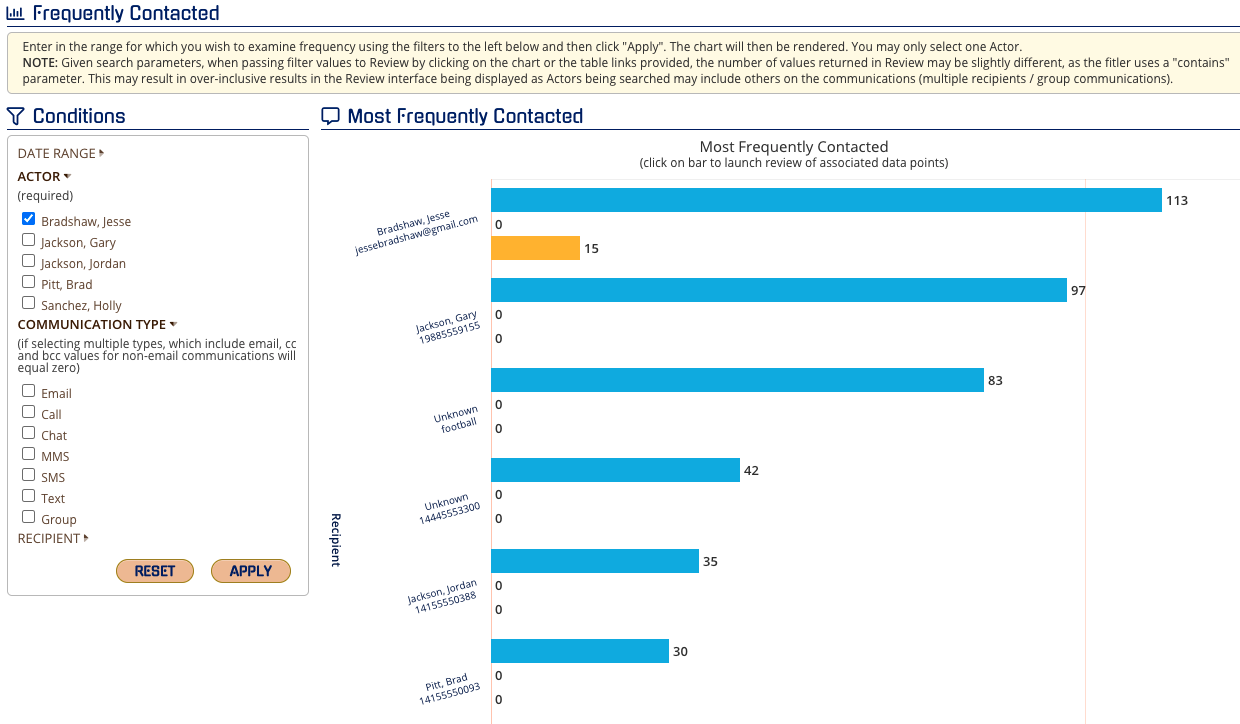
When you hover over the bar of interest, you can click through to view these items. For example, if I am interested in Gary Jackson and Jesse Bradshaw's conversations, I can click through to view those 97 items.
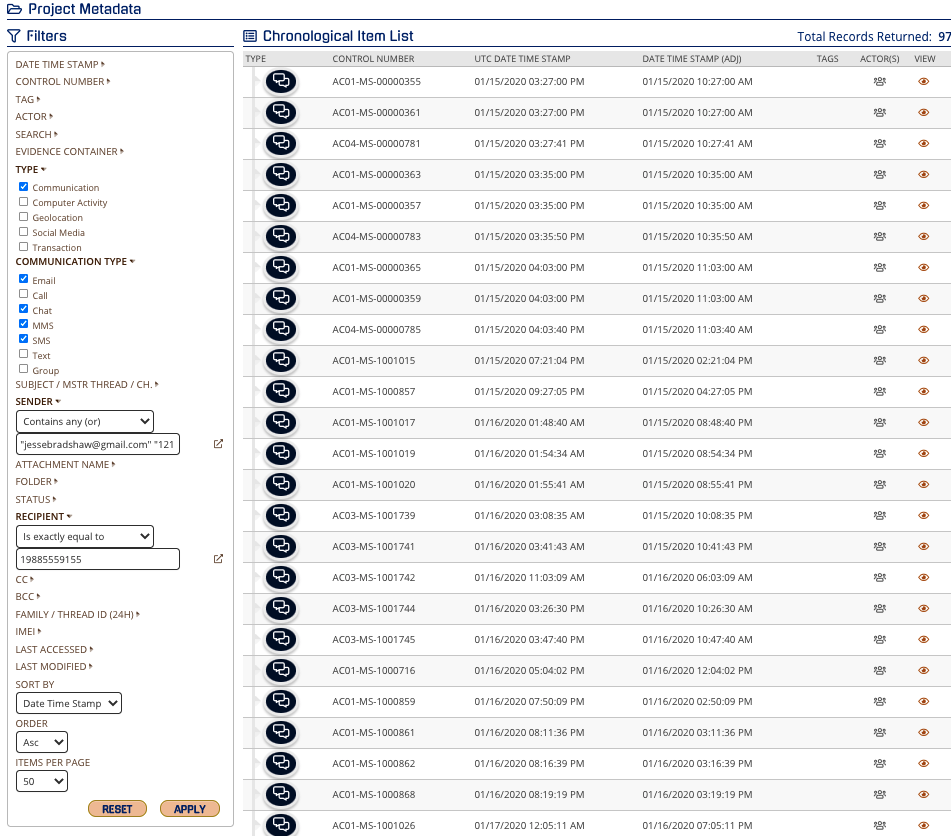
When I click through, I will be taken to the "Review Project Metadata" screen where I can view those items. The filters will be filled out as you just executed a search using the Analysis Tool.
Expanding, Printing, and Saving the Chart
For more information, please visit this link: https://support.esianalyst.com/portal/en/kb/articles/expanding-saving-and-printing-charts
Note: The PNG or PDF you are creating will ONLY show the view you are in. If there are multiple pages, you may want to create images from each page: 
Saving Your Analysis Tool
With all Analysis Tools, you can save your conditions and view by clicking "Save This Search" on your right pop-out panel and the current view will be saved.
Note: If you have added more data that would fall into your condition criteria, those items will show up in your saved search.