
Navigation
To navigate to the tag distribution chart, click on "Analysis Tools" in the "Review and Analysis" section of the project dashboard.
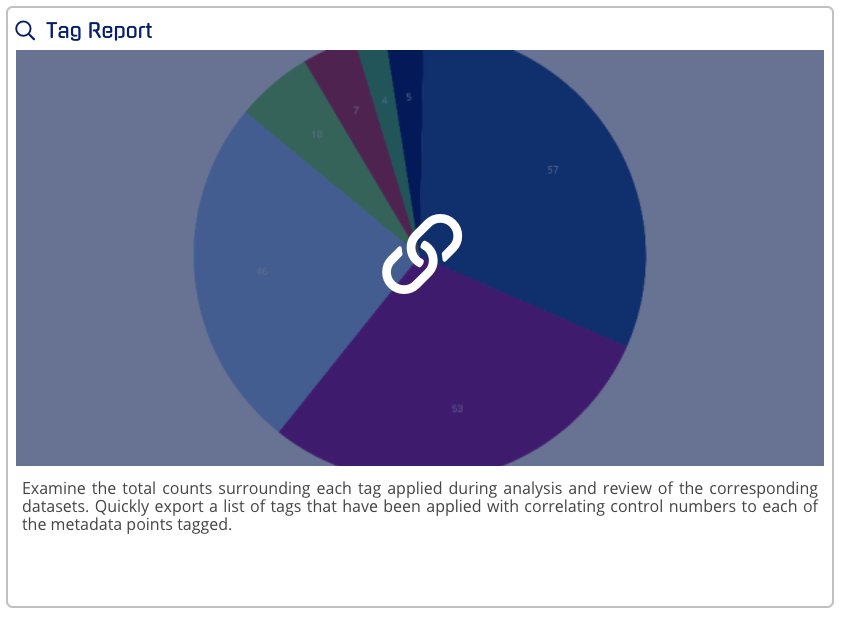
Then scroll to the bottom of the page and hover over the Tag Report tool. Once you see the tool turn gray and display a chain-link, click on it.
Tags and Filters
Examine the total counts surrounding each tag applied during analysis and review of the corresponding datasets. Quickly export a list of tags that have been applied with correlating control numbers to each of the metadata points tagged.
Once you select any filter criteria and click APPLY, you can click into any of the pie slices to go to a view with just those tags.
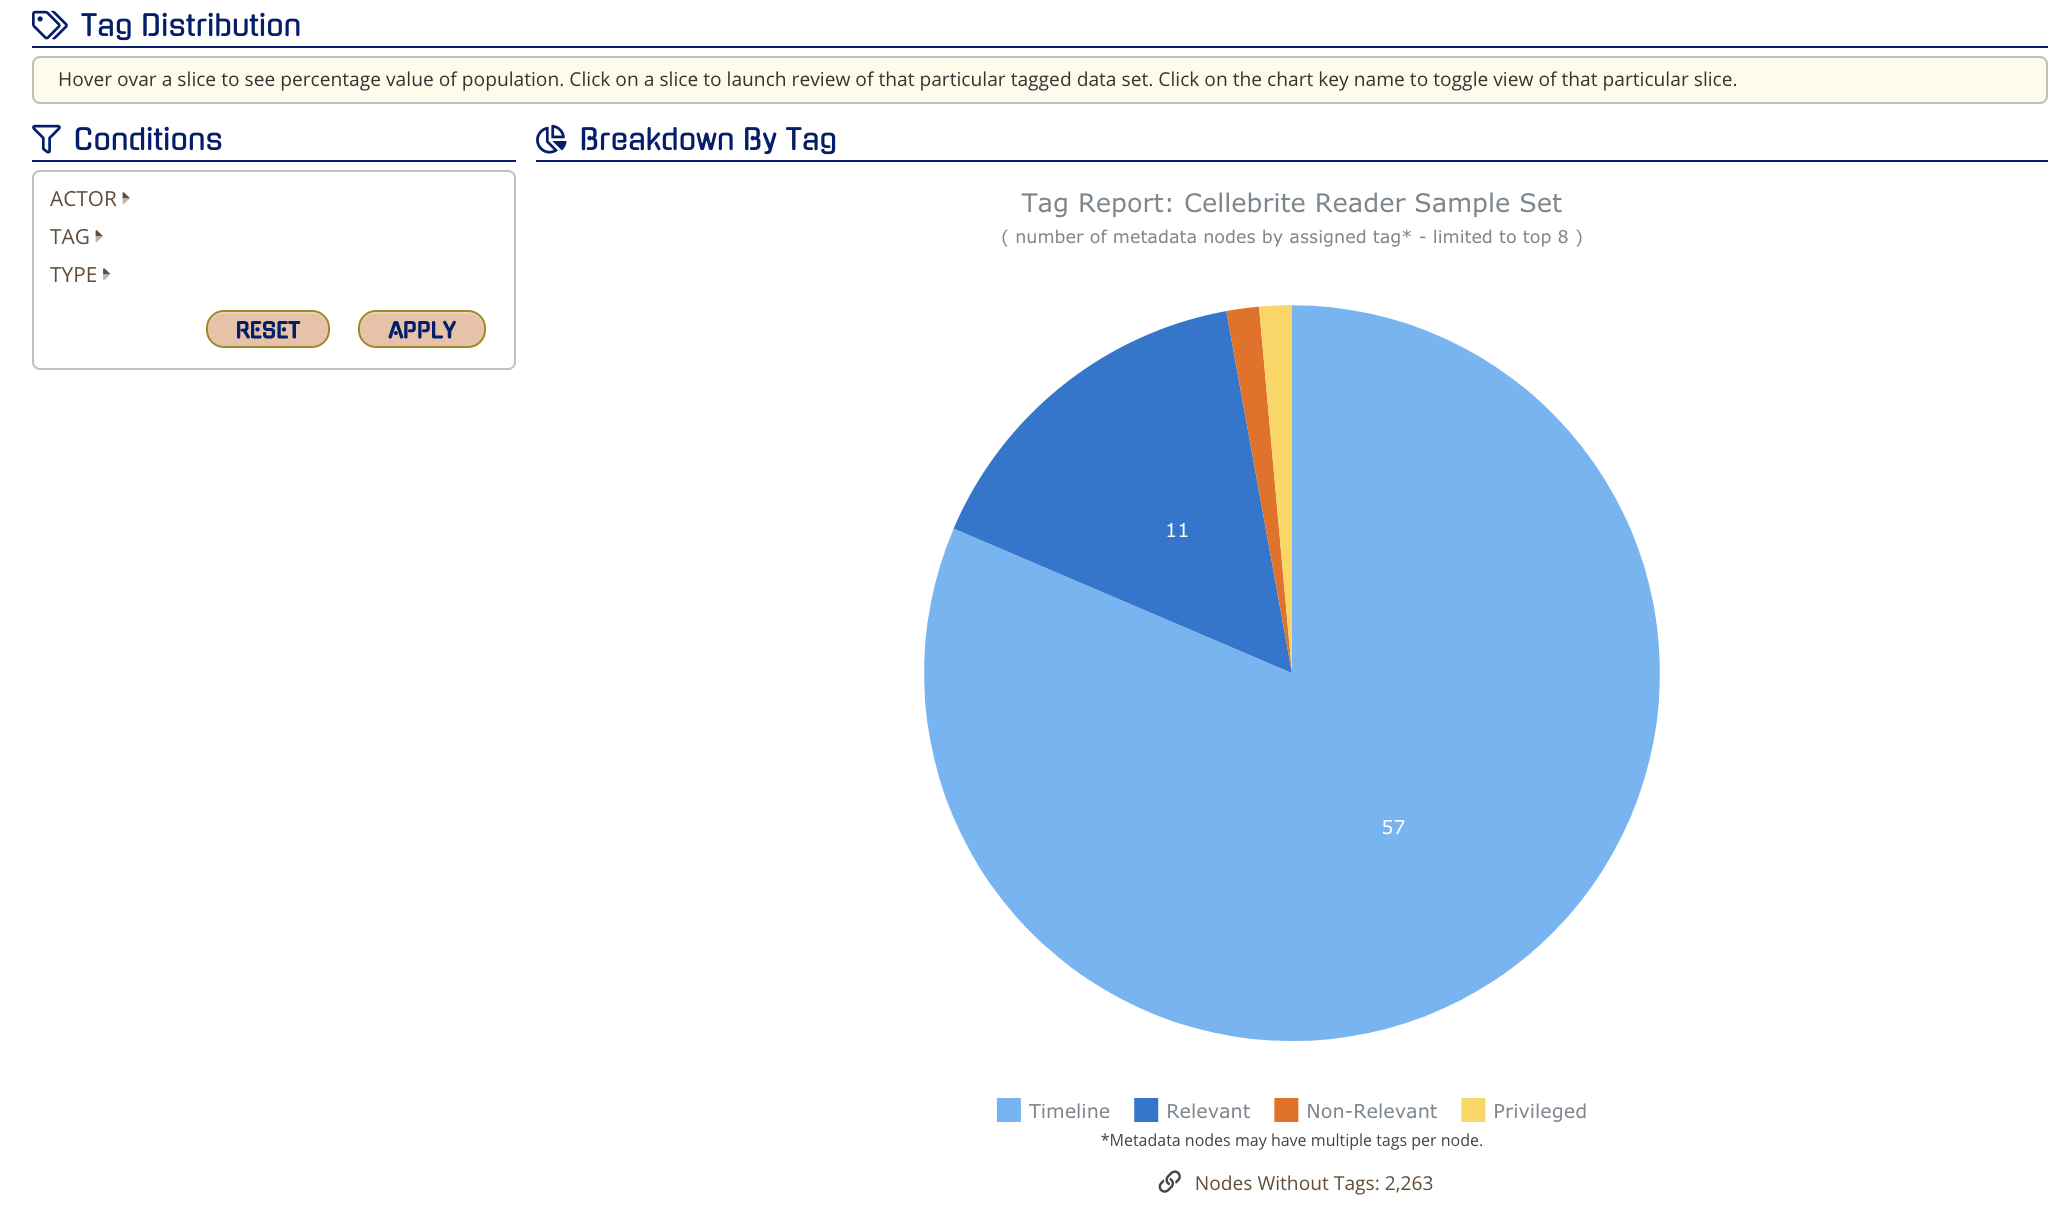
You also can select the tag to view in the table view by clicking the eye icon.
Expanding, Saving, and Printing Chart Data
For more information, please visit this link: https://support.esianalyst.com/portal/en/kb/articles/expanding-saving-and-printing-charts