
When you first click through to view your project you will see the main project landing page under Project Insights. At the top of this page, you will see the Tag Distribution chart that will show you the breakdown of the items you have tagged in the project.
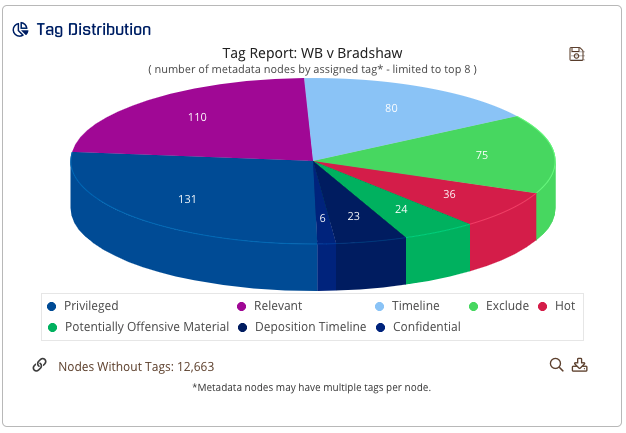
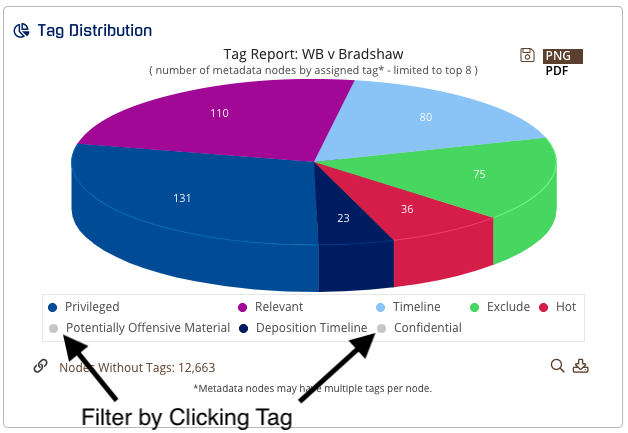
You can click on any of the data categories on the chart to go to just those items. You can also filter by clicking on the categories below
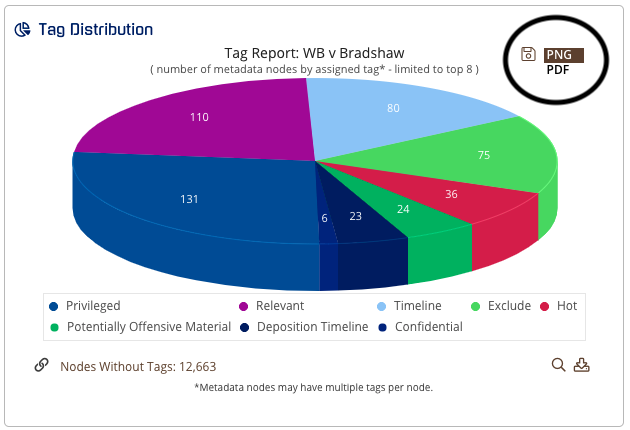
You can save the current view to a PDF or PNG file.
If users are actively tagging data and want to see real-time tagging results, you will need to refresh your page.