CloudNine Analyst: Using the Project Category Metadata Distribution
Using the Project Category Metadata Distribution
Metadata Distribution - Five Categories
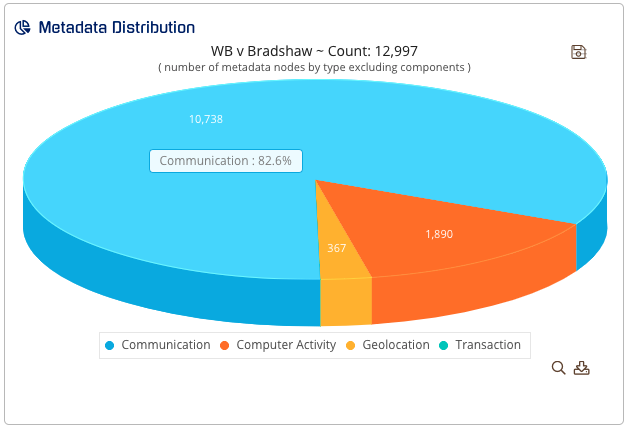
On the main project landing page under Project Insights, you will see the Metadata Distribution chart that will show you the breakdown of the items you have in the project. These five categories are Communication, Geolocation, Computer Activity, Social Media and Financial Transactions

You can save this chart to a CSV that will show the items by category. You can click through and view the items in the categories showing in the chart. You can click on any of the data categories on the chart to go to just those items.
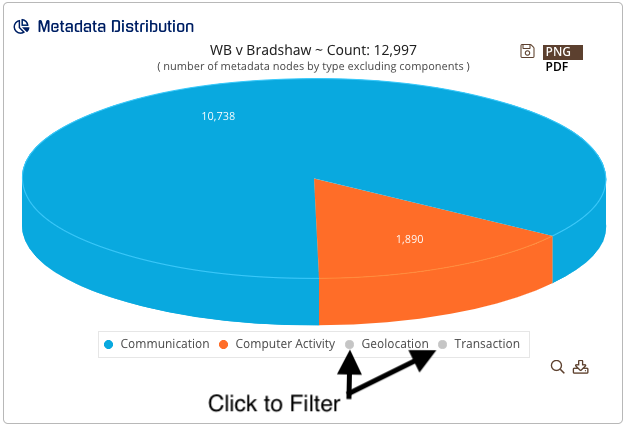
You can also filter by clicking on the categories below the main pie chart.

You can save the chart to a PDF or PNG File with current filtered view.

