
Navigation
To view reports for all your clients and projects, click "Dashboard" at the top of your screen.

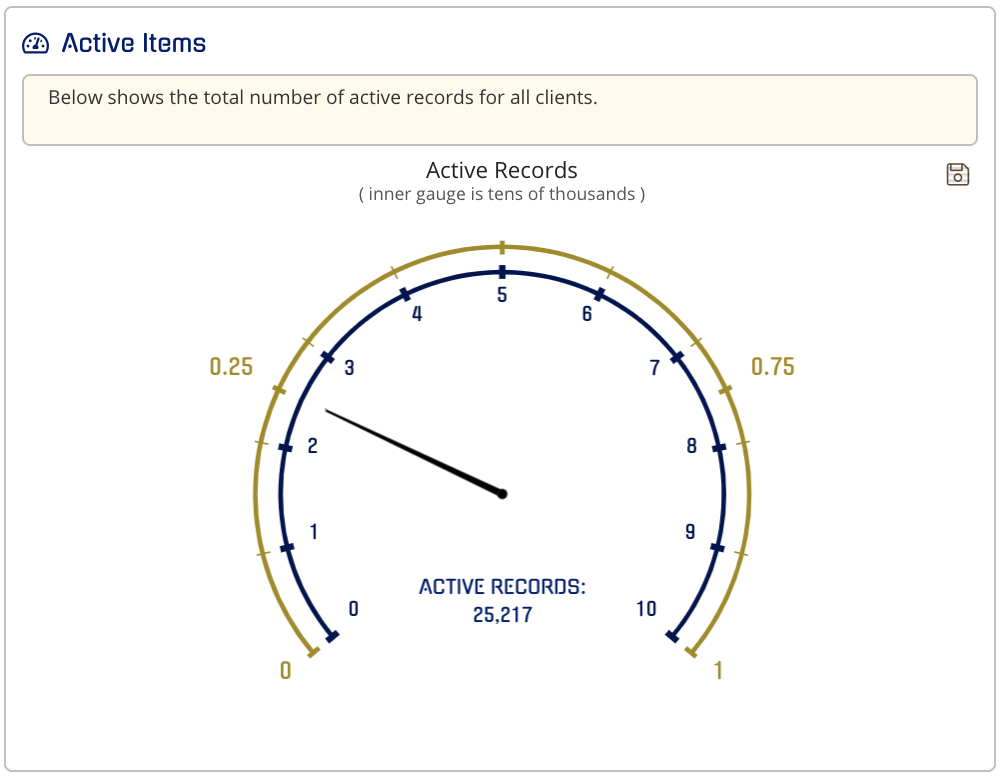
Active Items
The Active Items chart shows the total number of active records for all clients. To save the chart as a PNG or PDF, click on the camera icon in the top right corner.
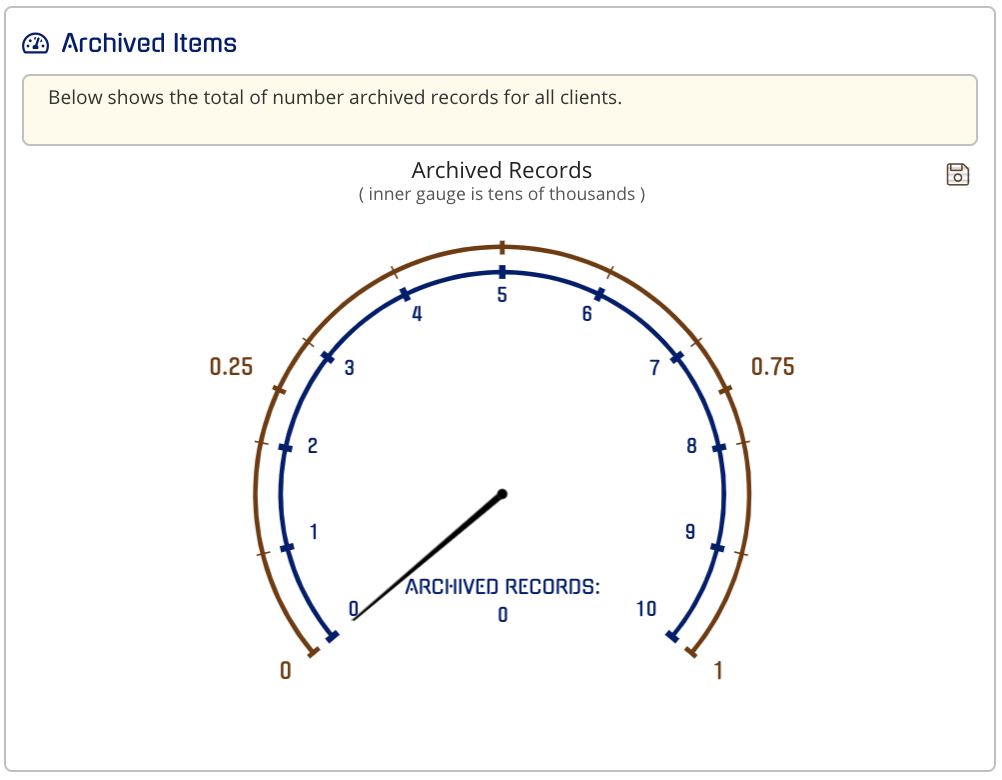
Archived Items
The Archived Items chart depicts shows the total number of archived records for all clients. To save the chart as a PNG or PDF, click on the camera icon in the top right corner.
Usage History Report
The usage history report depicts the number of nodes ingested by month.
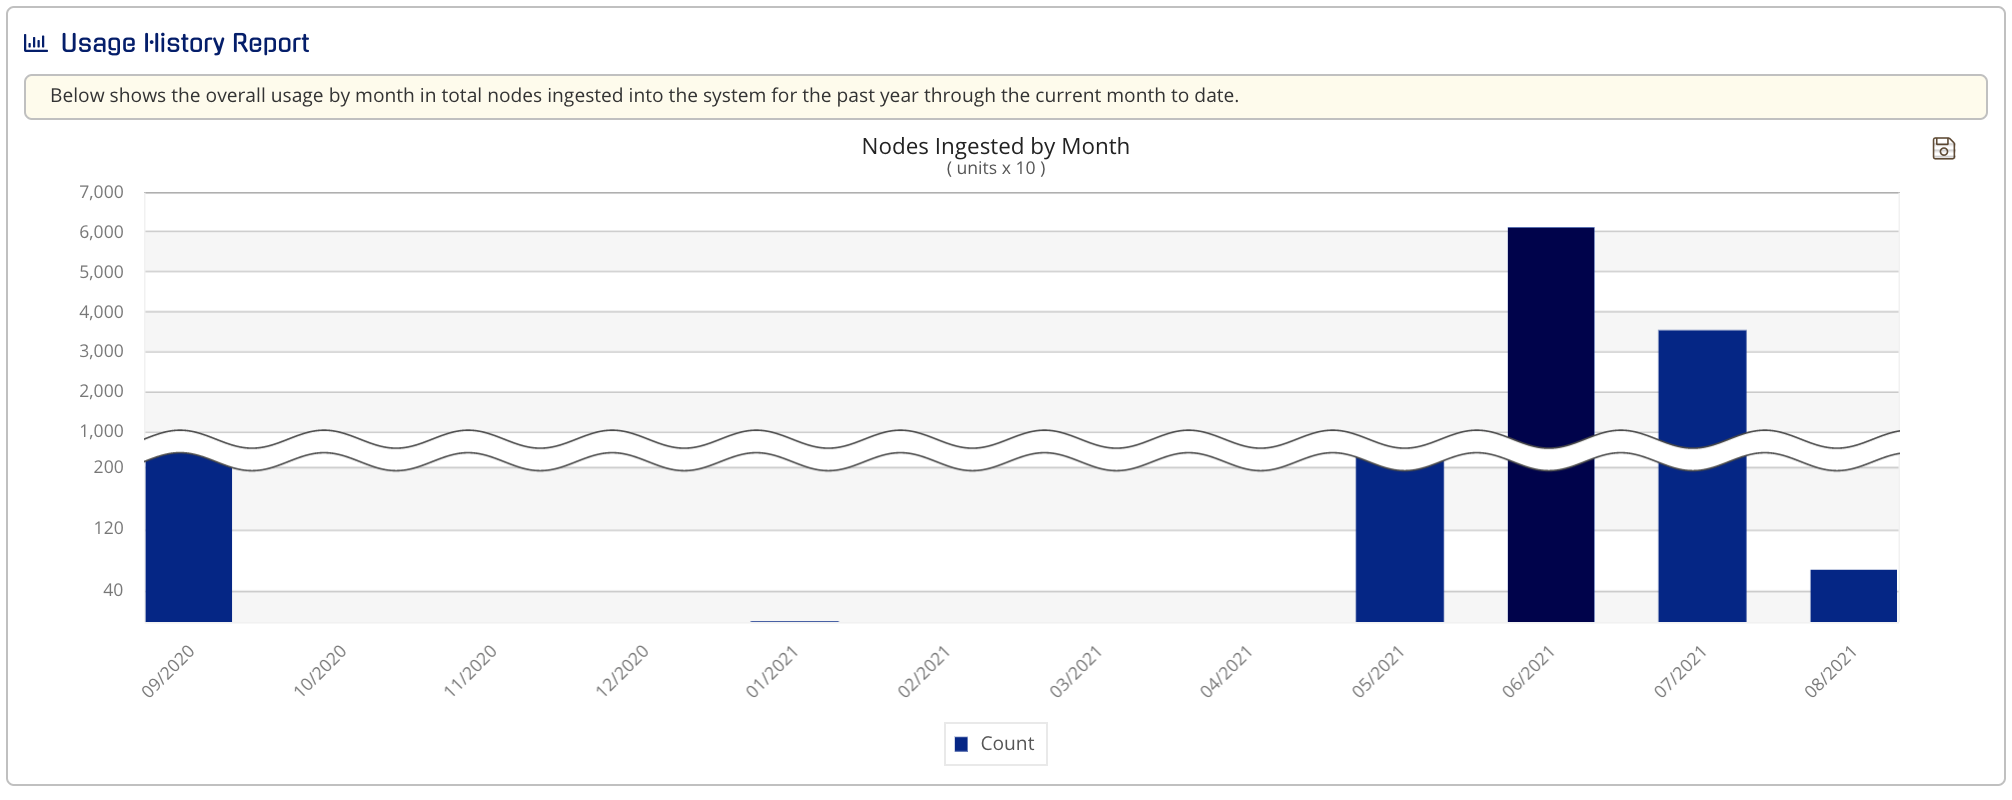
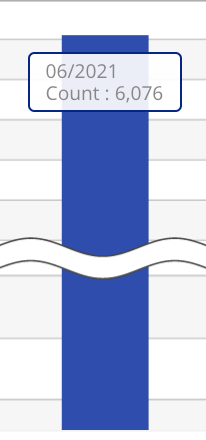
If you hover over an individual bar, you will see the exact number of ingested nodes for that month
Pressing the Count button will make all of the chart data disappear.